

These Australian Suburbs Are Booming Defying the Nationwide House Price Slump: PropCred Modelling Shows
PropCred Suburbs Defying the Australian Housing Slump

PropCred Research
National prices just posted their worst month since 2022 - so how are some suburbs still up 30% for the year?
This is an affordability-led correction, not a broad-based crash. The suburbs still growing share three traits: values below the city average, tight supply, and less rate-sensitive buyers.”
MELBOURNE, VICTORIA, AUSTRALIA, August 4, 2026 /EINPresswire.com/ -- Australia's widening property downturn is not hitting all suburbs equally, according to analysis by property research platform PropCred. While national dwelling values fell 0.7% in July, the sharpest monthly decline since December 2022, a closer look at the suburb-level data reveals a sharply two-speed market: higher-priced inner-city areas are driving the falls, while affordable outer-fringe corridors, mining regions and lifestyle markets continue to record double-digit annual growth.— Matt Proctor
Where values are falling
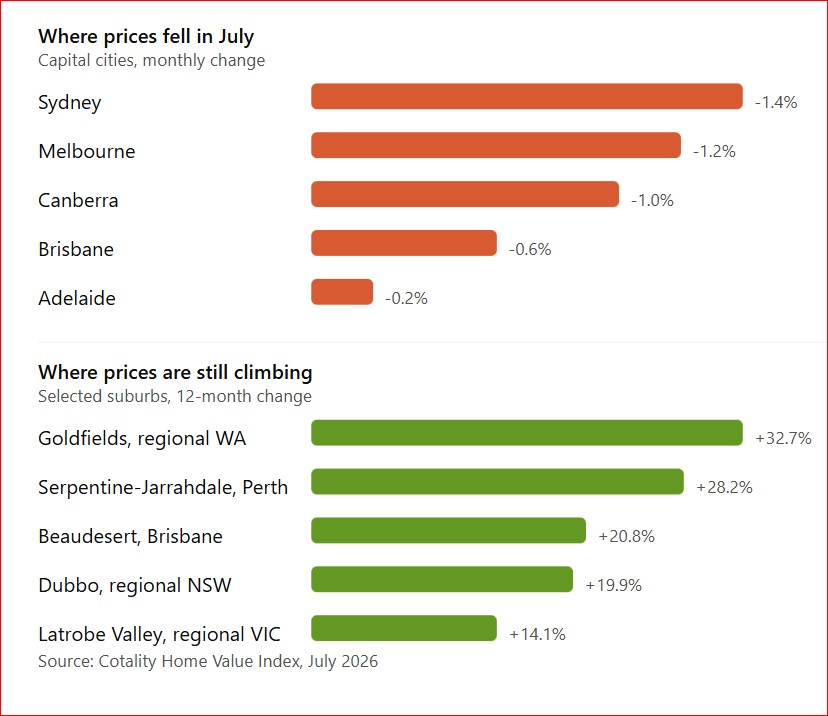
The downturn remains concentrated in Sydney (-1.4% for the month, -4.0% for the quarter) and Melbourne (-1.2% and -3.4%), and within those cities the pain is skewed to the top end. Nationally, upper-quartile home values dropped 3.2% over the three months to July, while the lower price tier actually edged up 0.3%.
Canberra is quietly one of the weakest markets in the country, down 1.0% in July and 4.2% below its 2022 peak, with inner areas such as North Canberra (-1.3%), Molonglo (-0.5%), Woden Valley and South Canberra (-0.4% each) all going backwards over the past year.
Even in Melbourne, where every top-ten growth suburb is positive, the numbers are anaemic: the city's best-performing SA3, Sunbury, managed just 4.3% annual growth, and established middle-ring areas like Wyndham and Tullamarine–Broadmeadows scraped 0.8%.
The softness has now spread to the regions, with the combined regional index falling 0.2% in July, its first monthly decline since January 2023, led by regional NSW (-0.4%) and regional Victoria and Queensland (-0.3% each).
Where values are holding or growing
At the other end of the spectrum, Perth's outer suburbs remain the nation's growth engine. Serpentine–Jarrahdale leads all capital-city SA3s with 28.2% annual growth, followed by Rockingham (25.3%), Armadale (25.0%) and Swan (24.2%), all corridors where median values sit below the metropolitan average.
Darwin has emerged as the strongest capital, up 0.8% in July and 16.3% over the year, with Darwin City dwellings up 17.1% annually. Regional WA is stronger still: the Goldfields recorded 32.7% annual growth, with West Pilbara (24.0%) and the northern Wheat Belt (23.9%) close behind.
Brisbane's affordable southern corridor, Beaudesert (20.8%), Beenleigh (19.4%) and Springwood–Kingston (18.7%), is still posting nearly 20% annual gains despite the city recording its second consecutive monthly fall, while regional SA and WA bucked the national trend entirely in July, rising 1.4% and 0.9% respectively.
Even within Sydney, the suburbs holding up best are the affordable growth corridors: Richmond–Windsor (7.5%), Wyong (7.4%) and Camden (7.0%) top the annual growth tables while the city as a whole sits 5.3% below its January peak.
State-by-state: where growth is holding up
New South Wales. Sydney's own fringe is still climbing even as the city falls: Richmond–Windsor (7.5%), Wyong on the Central Coast (7.4%), Camden (7.0%), Wollondilly (6.7%) and Penrith (6.1%) all posted solid annual growth. Outside Sydney, regional NSW growth is led by inland and regional centres, Dubbo (19.9%), Wagga Wagga (19.1%), Armidale (18.5%), Inverell–Tenterfield (17.6%) and Tamworth–Gunnedah (13.6%), all well ahead of the regional NSW average of 6.8%.
Victoria. Melbourne's growth is modest by comparison, topped by Sunbury (4.3%), Brimbank (3.7%), Casey–South (2.8%) and Casey–North (1.9%), all outer, more affordable corridors. Regional Victoria is doing considerably better: Latrobe Valley leads at 14.1%, followed by the Grampians (13.5%), Loddon–Elmore around Bendigo (12.3%), Glenelg–Southern Grampians near Warrnambool (12.1%) and Ballarat (11.4%).
Queensland. Brisbane's Logan corridor continues to outperform despite the city's second straight monthly fall, Beaudesert (20.8%), Sherwood–Indooroopilly (20.4%), Beenleigh (19.4%), Nundah (18.8%) and Springwood–Kingston (18.7%) all recorded close to 20% annual growth. Regional Queensland is stronger again, led by the Darling Downs, Darling Downs–East (23.8%) and Darling Downs (West)–Maranoa (22.0%), followed by Central Highlands (Qld) (21.2%), Burnett (20.3%) and Toowoomba (17.3%).
The pattern buyers should watch
"The July data confirms what we've been seeing in our valuation work for months, this is an affordability-led correction, not a broad-based crash," said Matt Proctor, Principal Analyst at PropCred. "The suburbs going backwards are overwhelmingly higher-value, investor-heavy markets where borrowing capacity has been hit hardest by the 75 basis points of rate rises this year. The suburbs still growing share three traits: median values below their city's average, tight local supply, and buyer pools that are less rate-sensitive, owner-occupiers on the fringe, or cashed-up buyers in resource and lifestyle regions."
Mr Proctor cautioned that the growth markets are not immune. "Brisbane and Adelaide's headline monthly declines tell us the correction is moving down the price curve. The outer corridors still showing 20% annual growth are living off momentum from late 2025, the monthly numbers will be the ones to watch through spring. For buyers, though, this divergence is actionable: negotiating power is strongest in the premium suburbs where listings are elevated and clearance rates are below 50%, while the affordable corridors still demand realistic pricing."
With suburb-level performance diverging this sharply, Mr Proctor said the safest move for buyers is to check the specific property and street rather than rely on city or even suburb-wide averages. "A 20% annual growth figure for a whole SA3 can mask enormous variation street to street, and the same is true in reverse in the falling markets, some pockets of Sydney and Melbourne are still holding value while the median slides," he said. PropCred offers a free property check for property buyers wanting to see where a specific address sits against this data, with the option to request a fully independent, analyst-reviewed report and valuation before making an offer.
Matt Proctor
PropCred
email us here
Visit us on social media:
LinkedIn
X
Legal Disclaimer:
EIN Presswire provides this news content "as is" without warranty of any kind. We do not accept any responsibility or liability for the accuracy, content, images, videos, licenses, completeness, legality, or reliability of the information contained in this article. If you have any complaints or copyright issues related to this article, kindly contact the author above.
